The year 1968 was a watershed in American history and black America’s ongoing fight for equality. In April of that year, Martin Luther King Jr. was assassinated in Memphis and riots broke out in cities around the country. Rising against this tragedy, the Civil Rights Act of 1968 outlawing housing discrimination was signed into law. Tommie Smith and John Carlos raised their fists in a black power salute as they received their medals at the 1968 Summer Olympics in Mexico City. Arthur Ashe became the first African American to win the U.S. Open singles title, and Shirley Chisholm became the first African American woman elected to the House of Representatives.
The same year, the National Advisory Commission on Civil Disorders, better known as the Kerner Commission, delivered a report to President Johnson examining the causes of civil unrest in African American communities. The report named “white racism”—leading to “pervasive discrimination in employment, education and housing”—as the culprit, and the report’s authors called for a commitment to “the realization of common opportunities for all within a single [racially undivided] society.”1 The Kerner Commission report pulled together a comprehensive array of data to assess the specific economic and social inequities confronting African Americans in 1968.
Where do we stand as a society today? In this brief report, we compare the state of black workers and their families in 1968 with the circumstances of their descendants today, 50 years after the Kerner report was released. We find both good news and bad news. While African Americans are in many ways better off in absolute terms than they were in 1968, they are still disadvantaged in important ways relative to whites. In several important respects, African Americans have actually lost ground relative to whites, and, in a few cases, even relative to African Americans in 1968.
Following are some of the key findings:
- African Americans today are much better educated than they were in 1968 but still lag behind whites in overall educational attainment. More than 90 percent of younger African Americans (ages 25 to 29) have graduated from high school, compared with just over half in 1968—which means they’ve nearly closed the gap with white high school graduation rates. They are also more than twice as likely to have a college degree as in 1968 but are still half as likely as young whites to have a college degree.
- The substantial progress in educational attainment of African Americans has been accompanied by significant absolute improvements in wages, incomes, wealth, and health since 1968. But black workers still make only 82.5 cents on every dollar earned by white workers, African Americans are 2.5 times as likely to be in poverty as whites, and the median white family has almost 10 times as much wealth as the median black family.
- With respect to homeownership, unemployment, and incarceration, America has failed to deliver any progress for African Americans over the last five decades. In these areas, their situation has either failed to improve relative to whites or has worsened. In 2017 the black unemployment rate was 7.5 percent, up from 6.7 percent in 1968, and is still roughly twice the white unemployment rate. In 2015, the black homeownership rate was just over 40 percent, virtually unchanged since 1968, and trailing a full 30 points behind the white homeownership rate, which saw modest gains over the same period. And the share of African Americans in prison or jail almost tripled between 1968 and 2016 and is currently more than six times the white incarceration rate.
Educational attainment
The most important development since 1968 is that African Americans today are much better educated than they were in 1968. These absolute improvements in educational attainment—including substantial increases in both high school and college completion rates—have opened important doors for black workers compared with their counterparts 50 years ago. In relative terms, African Americans today are almost as likely as whites to have completed high school. But even though the share of younger African Americans with a college degree has more than doubled, African Americans today are still only about half as likely to have a college degree as whites of the same age.
High school graduation rates. Over the last five decades, African Americans have seen substantial gains in high school completion rates. In 1968, just over half (54.4 percent) of 25- to 29-year-old African Americans had a high school diploma. Today, more than nine out of 10 African Americans (92.3 percent) in the same age range had a high school diploma. (See Table 1 for all data presented in this report.)
The large increase in high school completion rates helped to close the gap relative to whites. In 1968, African Americans trailed whites by more than 20 percentage points (75.0 percent of whites had completed high school, compared with 54.4 percent of blacks). In the most recent data, the gap is just 3.3 percentage points (95.6 percent for whites versus 92.3 percent for African Americans).
College graduation rates. College graduation rates have also improved for African Americans. Among 25- to 29-year-olds, less than one in 10 (9.1 percent) had a college degree in 1968, a figure that has climbed to almost one in four (22.8 percent) today.
Over the same period, however, college completion expanded for whites at a similar pace, rising from 16.2 percent in 1968 to 42.1 percent today, leaving the relative situation of African Americans basically unchanged: in 1968 blacks were just over half (56.0 percent) as likely as whites to have a college degree, a situation that is essentially the same today (54.2 percent).2
We would expect that these kinds of increases in the absolute levels of formal education would translate into large improvements in economic and related outcomes for African Americans. The rest of our indicators test the validity of this assumption.
Unemployment
The unemployment rate for African Americans in 2017 (the last full year of data) was 7.5 percent, 0.8 percentage points higher than it was in 1968 (6.7 percent). The unemployment rate for whites was 3.8 percent in 2017 and 3.2 percent in 1968.3
The unemployment data for these two years, almost 50 years apart, demonstrate a longstanding and unfortunate economic regularity: the unemployment rate for black workers is consistently about twice as high as it is for white workers.
Wages and income
Hourly wages. The inflation-adjusted hourly wage of the typical black worker rose 30.5 percent between 1968 and 2016, or about 0.6 percent per year. This slow rate of growth is particularly disappointing given the large increase in educational attainment among African Americans over these decades.
Even slower real wage growth (about 0.2 percent per year) for the typical white worker—albeit starting from a higher initial wage—meant that African Americans did modestly close the racial wage gap over the last five decades. But, in 2016, by the hourly wage measure used here, the typical black worker still only made 82.5 cents on every dollar earned by the typical white worker.4
Household income. The inflation-adjusted annual income of the typical African American household increased 42.8 percent between 1968 and 2016, slightly outpacing income growth for the typical white household (36.7 percent). But the typical black household today still receives only 61.6 percent of the annual income received by the typical white household.5
Poverty rates. The share of African Americans living in poverty has declined substantially in the last five decades. Using the official federal poverty measure as a benchmark, over one-third (34.7 percent) of African Americans were in poverty in 1968. Today, the share in poverty is just over one in five (21.4 percent). For whites, the decline in the poverty rate was much smaller, from 10.0 percent in 1968 to 8.8 percent in 2016. In the most recent data, African Americans are about 2.5 times as likely to be in poverty as whites. (In 1968, they were 3.5 times as likely to be in poverty.)6
Family wealth
The typical black family had almost no wealth in 1968 ($2,467; data refer to 19637). Today, that figure is about six times larger ($17,409), but it is still not that far from zero when you consider that families typically draw on their wealth for larger expenses, such as meeting basic needs over the course of retirement, paying for their children’s college education, putting a down payment on a house, or coping with a job loss or medical crisis.
Over the same period, the wealth of the typical white family almost tripled, from a much higher initial level. In 2016, the median African American family had only 10.2 percent of the wealth of the median white family ($17,409 versus $171,000).8
Homeownership. One of the most important forms of wealth for working and middle-class families is home equity. Yet, the share of black households that owned their own home remained virtually unchanged between 1968 (41.1 percent) and today (41.2 percent). Over the same period, homeownership for white households increased 5.2 percentage points to 71.1 percent, about 30 percentage points higher than the ownership rate for black households.9
Health
Infant mortality. Over the last five decades, African Americans have experienced enormous improvements in infant mortality rates. The number of deaths per 1,000 live births has fallen from 34.9 in 1968 to 11.4 in the most recent data. Over the same period, whites have also seen dramatic reductions in infant mortality, with rates falling from 18.8 to 4.9 by the same measure.
In relative terms, however, African Americans have fallen behind. In 1968, black infants were about 1.9 times as likely to die as white infants. Today, the rate is 2.3 times higher for African Americans.10
Life expectancy. African Americans’ life expectancy at birth has also increased substantially (up 11.5 years) between 1968 and today, outpacing the increase for whites (up 7.5 years). But an African American born today can, on average, still expect to live about 3.5 fewer years than a white person born on the same day.11
Incarceration
The share of African Americans in prison or jail almost tripled between 1968 (604 of every 100,000 in the total population) and 2016 (1,730 per 100,000).
The share of whites in prison or jail has also increased dramatically, but from a much lower base. In 1968, about 111 of every 100,000 whites were incarcerated. In the most recent data, the share has increased to 270 per 100,000.
In 1968, African Americans were about 5.4 times as likely as whites to be in prison or jail. Today, African Americans are 6.4 times as likely as whites to be incarcerated, which is especially troubling given that whites are also much more likely to be incarcerated now than they were in 1968.12
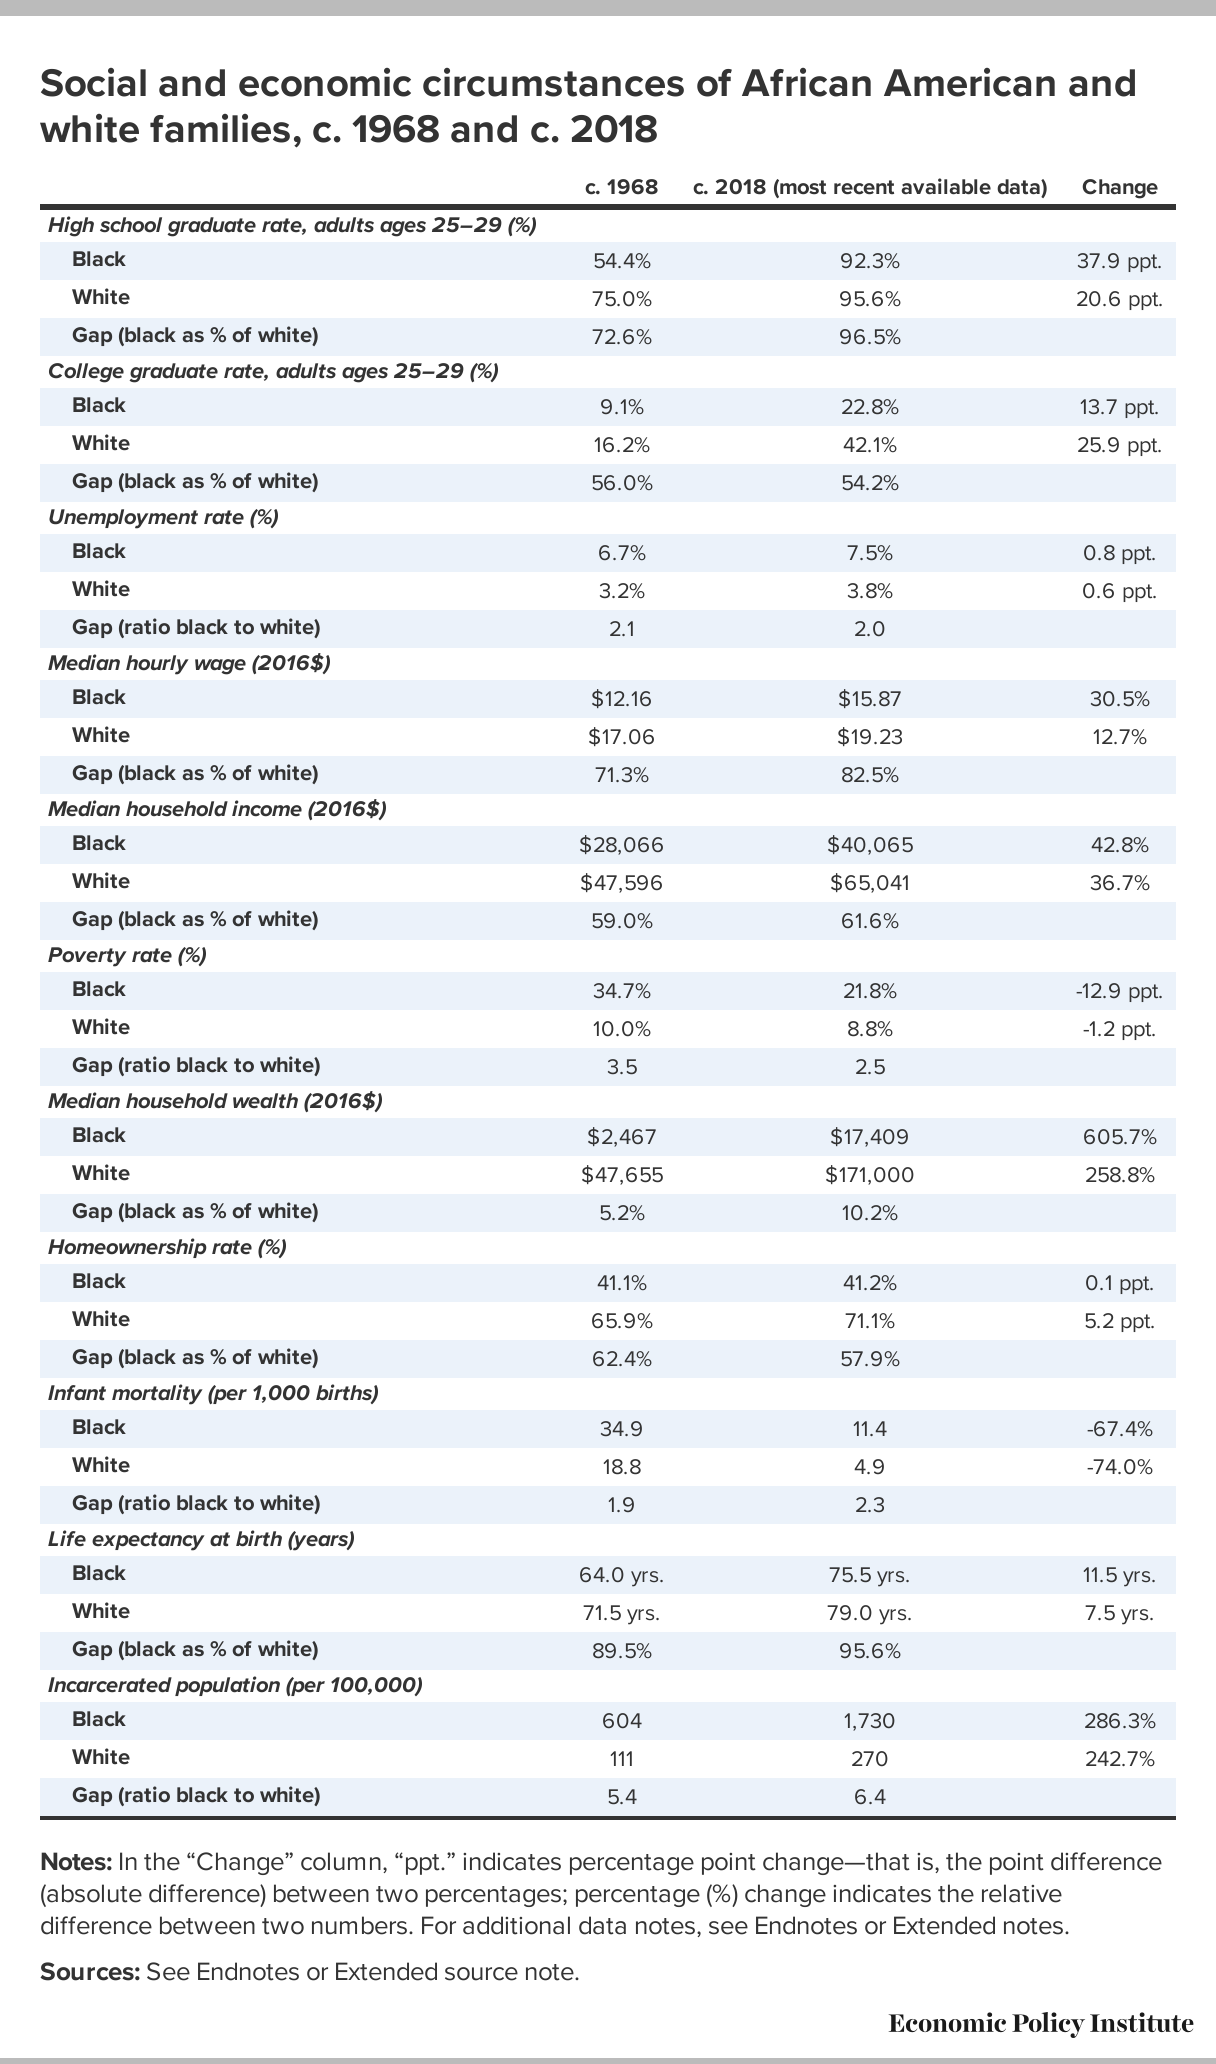
Social and economic circumstances of African American and white families, c. 1968 and c. 2018
| c. 1968 | c. 2018 (most recent available data) | Change | |
|---|---|---|---|
| High school graduate rate, adults ages 25–29 (%) | |||
| Black | 54.4% | 92.3% | 37.9 ppt. |
| White | 75.0% | 95.6% | 20.6 ppt. |
| Gap (black as % of white) | 72.6% | 96.5% | |
| College graduate rate, adults ages 25–29 (%) | |||
| Black | 9.1% | 22.8% | 13.7 ppt. |
| White | 16.2% | 42.1% | 25.9 ppt. |
| Gap (black as % of white) | 56.0% | 54.2% | |
| Unemployment rate (%) | |||
| Black | 6.7% | 7.5% | 0.8 ppt. |
| White | 3.2% | 3.8% | 0.6 ppt. |
| Gap (ratio black to white) | 2.1 | 2.0 | |
| Median hourly wage (2016$) | |||
| Black | $12.16 | $15.87 | 30.5% |
| White | $17.06 | $19.23 | 12.7% |
| Gap (black as % of white) | 71.3% | 82.5% | |
| Median household income (2016$) | |||
| Black | $28,066 | $40,065 | 42.8% |
| White | $47,596 | $65,041 | 36.7% |
| Gap (black as % of white) | 59.0% | 61.6% | |
| Poverty rate (%) | |||
| Black | 34.7% | 21.8% | -12.9 ppt. |
| White | 10.0% | 8.8% | -1.2 ppt. |
| Gap (ratio black to white) | 3.5 | 2.5 | |
| Median household wealth (2016$) | |||
| Black | $2,467 | $17,409 | 605.7% |
| White | $47,655 | $171,000 | 258.8% |
| Gap (black as % of white) | 5.2% | 10.2% | |
| Homeownership rate (%) | |||
| Black | 41.1% | 41.2% | 0.1 ppt. |
| White | 65.9% | 71.1% | 5.2 ppt. |
| Gap (black as % of white) | 62.4% | 57.9% | |
| Infant mortality (per 1,000 births) | |||
| Black | 34.9 | 11.4 | -67.4% |
| White | 18.8 | 4.9 | -74.0% |
| Gap (ratio black to white) | 1.9 | 2.3 | |
| Life expectancy at birth (years) | |||
| Black | 64.0 yrs. | 75.5 yrs. | 11.5 yrs. |
| White | 71.5 yrs. | 79.0 yrs. | 7.5 yrs. |
| Gap (black as % of white) | 89.5% | 95.6% | |
| Incarcerated population (per 100,000) | |||
| Black | 604 | 1,730 | 286.3% |
| White | 111 | 270 | 242.7% |
| Gap (ratio black to white) | 5.4 | 6.4 |
Notes: In the “Change” column, “ppt.” indicates percentage point change—that is, the point difference (absolute difference) between two percentages; percentage (%) change indicates the relative difference between two numbers. For additional data notes, see Endnotes or Extended notes.
Sources: See Endnotes or Extended source note.
Appendix: Data notes
Making comparisons over five decades is challenging. Data sources collected across so many years are not always directly comparable. One issue is that most government data in the 1960s grouped the population into only two groups: “white” and “nonwhite.” Following the Kerner Commission and other researchers, our figures here use the “nonwhite” data as a proxy for the circumstances of African Americans at the time. We are confident that the “nonwhite” data do a reasonably good job capturing the experience of African Americans. The 1970 census, which included more detailed information on race than most government data in the 1960s, estimates that people from races other than white and African American (primarily Native Americans and Asians) constituted only about 1.4 percent of the U.S. population at the time. The 1980 census allowed respondents of any race to identify themselves as Hispanic, and in that year only about 7 percent did so.
A second issue is that data specifically for 1968 are not always available. In these cases, we either use data for the closest available year, or we use data for years before and after 1968 (usually 1960 and 1970) and interpolate. Our data for “2018” are the most recent data available for each of the indicators we examine, typically either 2015, 2016, or 2017 data.
Endnotes
1. Report of the National Advisory Commission on Civil Disorders: Summary of Report (U.S. Government Printing Office), downloadable at www.hsdl.org.
2. Data for high school and college graduate rates among adults ages 25–29 are from the National Center for Education Statistics, “Table 104.20. Percentage of Persons 25 to 29 Years Old with Selected Levels of Educational Attainment, by Race/Ethnicity and Sex: Selected Years, 1920 through 2017,” 2017 Tables and Figures, accessed February 4, 2018, at nces.ed.gov/programs/digest. The most recent year is 2016. The 1968 figure is estimated as 0.2 times the figure for 1960 and 0.8 times the figure for 1970.
3. For 1968, unemployment data are from the Council of Economic Advisers, “Table B-43. Civilian Unemployment Rate by Demographic Characteristic, 1968–2009,” in Economic Report of the President 2010 (U.S. Government Printing Office), accessed February 4, 2018, at www.gpo.gov/fdsys. For 2018 (2017 data), we use Bureau of Labor Statistics data, data tools, www.bls.gov/data/#unemployment, series ID LNU04000003 and LNU04000006, accessed February 4, 2018.
4. Median hourly wage data are from EPI analysis of March Current Population Survey data for calendar years 1968 and 2016. Data for 1968 are converted to 2016 dollars using the CPI-U-RS chained to the CPI-U-X1.
5. Median household income data are from the U.S. Census Bureau, “Table H-5. Race and Hispanic Origin of Householder—Households by Median and Mean Income: 1967 to 2016,” Historical Income Tables, accessed February 4, 2018, at www.census.gov. The most recent year is 2016. Data for 1968 are converted to 2016 dollars using the CPI-U-RS chained to the CPI-U-X1.
6. Poverty rate data are from the U.S. Census Bureau, “Table 2. Poverty Status of People by Family Relationship, Race, and Hispanic Origin: 1959 to 2016,” Historical Poverty Tables, accessed February 4, 2018, at www.census.gov.
7. As noted in the appendix, data for 1968 are not always available. In this case, we use data for the closest available year, 1963.
8. Median household wealth data are from an Urban Institute analysis of Survey of Consumer Finances data, presented in “Chart 3: Average Family Wealth by Race/Ethnicity, 1963–2016,” in Nine Charts about Wealth Inequality in America, updated October 24, 2017. Data refer to 1963 and 2016. Data for 1963 are converted to 2016 dollars.
9. Homeownership rate data are from Laurie Goodman, Jun Zhu, and Rolf Pendall, “Are Gains in Black Homeownership History?” and accompanying downloadable spreadsheet, Urban Institute, February 15, 2017. The 1968 figure is estimated as 0.2 times the figure for 1960 and 0.8 times the figure for 1970. Most recent data refer to 2015.
10. Infant mortality rate data are from the Centers for Disease Control and Prevention, “Table 11. Infant Mortality Rates, by Race: United States, Selected Years 1950–2015,” Health, United States, 2016—Individual Charts and Tables, accessed February 4, 2018, at www.cdc.gov/nchs/hus. The 1968 figure is estimated as 0.2 times the figure for 1960 and 0.8 times the figure for 1970. Most recent data refer to 2015. The 1968 data are based on the race of the child; the 2015 data are based on the race of the mother.
11. Life expectancy data are from the Centers for Disease Control and Prevention, “Table 15. Life Expectancy at Birth, at Age 65, and at Age 75, by Sex, Race, and Hispanic Origin: United States, Selected Years 1900–2015,” Health, United States, 2016—Individual Charts and Tables, accessed February 4, 2018, at www.cdc.gov/nchs/hus. The 1968 figure is estimated as 0.2 times the figure for 1960 and 0.8 times the figure for 1970. Most recent data refer to 2015.
12. Incarcerated population data are from the authors’ calculations based on unpublished tabulations by Kris Warner of the Center for Economic and Policy Research, using Bureau of Justice Statistics and U.S. Census Bureau data.